
© Ali AlSaibie, PhD.
© Ali AlSaibie, PhD.
In this assignment you will be analyzing and applying a digital filter on pre-collected data offline.
Before attempting this assignment, make sure you go through the Prelab 6 first.
MATLAB v 2016b or higher, with DSP or Signal Processing Toolbox and Control System Toolbox
1. Lab Report Submission Guidelines
You will work within a single MATLAB Live Script file, add your comments and code within it and submit only a single *.mlx file + a single pdf exported from the Live Script (From Live Editor Tab, click on the save drop down menu and select Export as PDF).
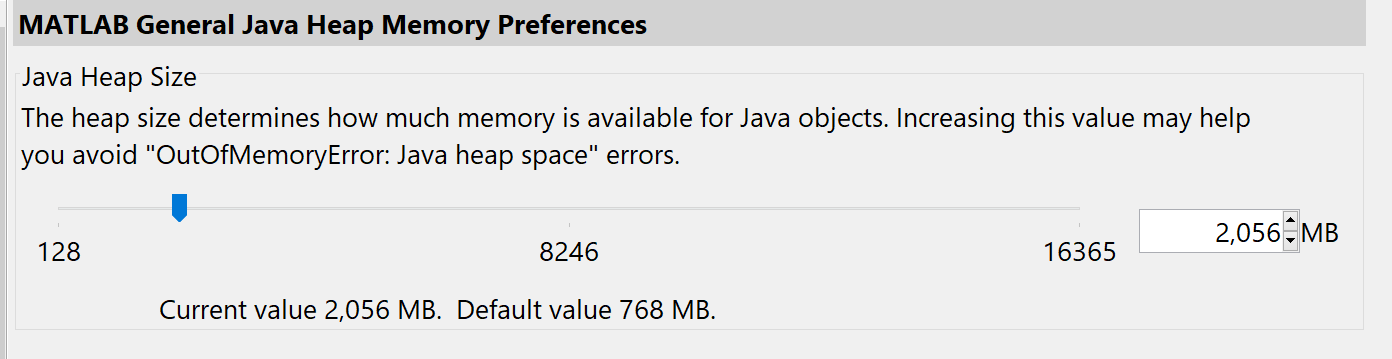
You may need to increase the heap size for MATLAB if you get an export to pdf error, by going to Home Tab then Preferences->MATLAB->General->Java Heap Memory, and doubling the allowable memory, this also speeds up MATLAB in general if you have spare RAM to allocate on your machine. You can also submit a Jupyter notebook (Julia, Python or MATLAB)
Perform the following in a MATLAB Live Script or Jupyter Notebook.
Import the provided sensor data from the Dataset_Medium_Tap.xls file and into MATLAB
Plot the acceleration in the z direction
a. Explain your observation about the data
Analyze the acceleration data using FFT
a. Explain your observation about the frequency characteristic of the data
Design a Low Pass First Order Filter on the accelerometer data
a. Implement the filter using the difference equation method
b. Compare the filtered output to the unfiltered output, and explain the observed differences
Design a Low Pass Butterworth second order filter to improve the filter performance
a. Implement the filter using the difference equation method
b. Compare the filtered output to the unfiltered output, as well as to the filtered output from the first order filter, and explain the observed difference.
Apply the Low Pass Butterworth second-order filter on the z-axis accelerometer data from the Dataset_Slow_Tap and Dataset_Fast_Tap data. Plot in 3 adjacent subplots the unfiltered and filtered signal for each of the 3 data sets z-axis accelerometer data.
To read an excel table in MATLAB, you can use the function readtable()
table = readtable("Dataset_Medium_Tap.xlsx");
% Plot data
figure()
plot(table.Time_ms_, table.AccZ_mg_);