
© Ali AlSaibie, PhD.
© Ali AlSaibie, PhD.
In this assignment you will be analyzing and applying a digital filter, online. Before attempting this assignment, make sure you go through the Prelab 7 first.
MATLAB v 2016b or higher, with DSP or Signal Processing Toolbox and Control System Toolbox
Nucleo F401RE
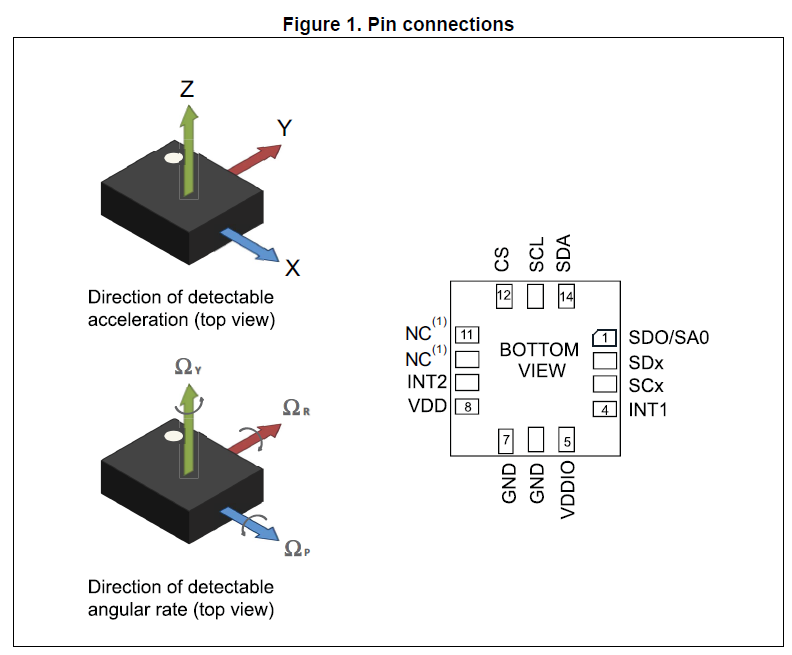
IKS01A02 Expansion Board
1. Lab Report Submission Guidelines
You will work within a single MATLAB Live Script file, add your comments and code within it and submit only a single *.mlx file + a single pdf exported from the Live Script (From Live Editor Tab, click on the save drop down menu and select Export as PDF).
You can also submit a Jupyter notebook (Julia, Python or MATLAB)
Using your experience from Lab 5, setup a JSON serialization to capture the following sensor data and plot them in MATLAB in real-time, on 3 subplots.
Accelerometer X and Z axes on one subplot.
Pressure data in one subplot.
Preserve the third subplot for the next task.
Use the magnitude of the X and Z of the accelerometer values to estimate the pitch angle of the board. (Hint: atan2()). Print the data through the serial terminal and then plot them in real-time on MATLAB, using the MATLAB script from the previous step. Add the pitch angle as a third subplot.
Log the data of the sensor, as explained in the prelab, while rotating the sensor about the y-axis. Change the number of samples logged according to your needs. Repeat the analysis you did in Lab 6, and apply the following filters
1. A first order Low Pass Filter on the Accelerometer Z-Axis, then
2. A second order Low Pass Filter on the Accelerometer Z-Axis
Remember that the filter is a difference equation you apply on the data to be filtered. But unlike in MATLAB, where you loop through all the data to be filtered at once, on the MCU, you apply the difference equation once per new sample, so you only need to store (in variables you create your own) the previous values of the input/output, depending on the filter used.
Explain the observed differences between the unfiltered and filtered response, as well the differences between the offline filter performance and the online filter performance.
Log the data of the sensor while moving the board up/down stair-steps (Yes, carry your laptop with you), and then perform filter design steps in MATLAB similar to previous analyses, then apply a filter of your choice to improve the output data. Test the filter on the board, log the data again (print both the unfiltered and filtered values), while walking up/down the stairs again and plot the two values.